 |
Download: Presentation |
A common problem limiting our understanding of multi-phase flow and transport is the lack of information about the microscopic geometry and associated processes in porous media. Recent advances in pore-scale modeling have allowed simulation of fluid flow processes on the micro-scale. On the macro-scale, macropore and preferential flow are suggested as important mechanisms for accelerated breakthrough of contaminants, however, to fully understand the significance of immobile water regions, as well as dispersion and diffusion processes, it is becoming increasingly clear that pore-scale measurements are needed. The mechanisms, operating at both macro- and micro-scales, are difficult to understand based on traditional measurement techniques, which generally require insertion of a sensor at or near the region of interest.
A combination of advances in experimental techniques and mathematical analysis has made it possible to characterize phase distribution and pore geometry in porous media using non-destructive x-ray computerized tomography (CT). In the past 10 years or so we have obtained qualitative and quantitative CT results for partially-saturated media, obtained with different scanning systems and sample sizes, to illustrate advantages and limitations of these various systems, including topics of spatial resolution and contrast. In addition, we present examples of our most recent three-dimensional high-resolution images, for which it was possible to resolve individual pores and to delineate air-water interfacial area. This kind of resolution provides a novel opportunity to follow the dynamic flow behavior on the pore scale and to verify new theoretical and numerical modeling approaches.
Different CT systems provide for different spatial resolutions. Industrial and medical x-ray tubes allow for spatial resolutions of 100-1000 µm, whereas a synchrotron-based computerized microtomography (CMT) system provides a spatial resolution of 5-20 µm.
A. Review of x-ray CT
B. Flow and transport measurements in porous media
C. Recent developments at Advanced Photon Source Measurements
at Argonne National Laboratory, Chicago and McClellan Nuclear Reactor
in Sacramento.
____________________________________________________________
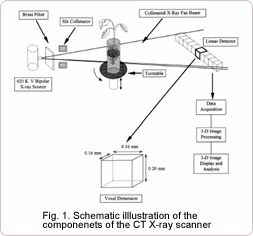
Conventional tube x-rays are produced in a highly evacuated glass bulb of an x-ray tube, consisting of two electrodes: usually a platinum or tungsten anode and a cathode. When a high voltage is applied between these electrodes, accelerated electrons (cathode rays) produce x-rays as they strike the anode. Two different processes give rise to radiation in the x-ray frequency. First, the high-speed electrons themselves produce radiation as they are decelerated by the positively charged nuclei of the anode material. This radiation is defined as brehmsstrahlung (German for braking radiation). Second, x-ray radiation is emitted after excited electrons of the target material fall back to their original shell position. Commercial medical and industrial scanners use this type of x-ray sources. In contrast, synchrotron radiation is electromagnetic radiation emitted by high-speed electrons spiraling in a magnetic field of a particle accelerator. The electron beam is steered and focused in a ring by large electromagnets, resulting in the emission of synchrotron radiation by the decelerating electrons. Depending on the electron's energy and the strength of the magnetic field, the emitted energy can be by radio waves, visible light, or x-rays.
A beam of x-rays is characterized by its photon flux density or intensity and spectral energy distribution. For monochromatic radiation with an incident intensity I0, the x-ray beam is attenuated after passing through a sample of thickness D [L], to yield an attenuated intensity I, with a magnitude described by Lambert-Beer’s law
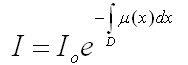
where µ denotes the linear attenuation coefficient [L-1], which depends on the electron density of the material, the energy of the radiation, and the bulk density of the sample material. In contrast to the two-dimensional representation by radiography, computerized axial tomography (CAT or CT) technique was developed in the medical sciences in the late sixties and early seventies. It required the development of mathematical reconstruction techniques to determine the spatial distribution of attenuation values within the object from multiple ray measurements. The three-dimensional imaging procedure requires the inverse solution of the attenuation equation, allowing for the estimation of the spatial variation of attenuation values along the ray path. The detection of x-rays is done by measuring the light intensity emitted by a fluorescing screen using a CCD (charged-coupled device) camera. Since the CCD measures visible light intensity, it is used with a high-resolution scintillator (e.g. Yttrium-Aluminum-Garnet phosphor screen) that converts x-rays into visible light. The CCD detector consists of an areal arrangement of diodes, thereby allowing for simultaneous attenuation measurements of multiple stacked planes, producing an instantaneous three-dimensional map of attenuation values.
References:
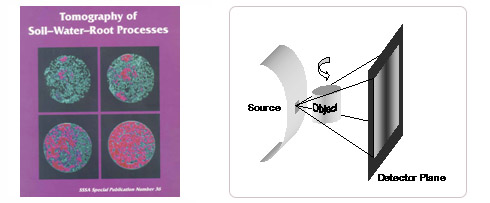
Anderson, S. E. and J. W. Hopmans. (Editors), 1994. Tomography of soil water root processes. Special Publication Number 36, Soil Science Society of America.
Asseng, S., L.A. G. Aylmore, J. S. MacFall, and J.W. Hopmans. 2000. X-ray computed tomography and magnetic resonance imaging. IN: Root Methods: a Handbook. A.L.Smit, A.G. Bengough, C. Engels, M. van Noordwijk, S. Pellerin, and S.C. van de Geijn (Eds.). Springer. Pages 343-364.
Wildenschild, D., J.W. Hopmans, C.M.P. Vaz, M.L. Rivers, D. Rikard, and B.S.B. Christensen. 2002. Using X-ray computed tomography in hydrology: systems, resolutions, and limitations. J. of Hydrology 267:285-297.DOWNLOAD: PDF
B. Flow and Transport Measurements using X-ray CT
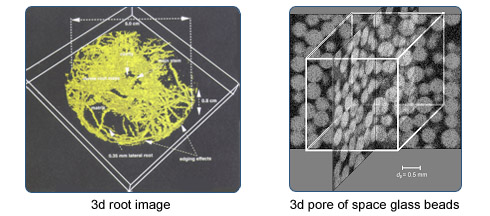
Roots: The nondestructive three-dimensional image of a plant root in situ was derived with a high-energy industrial x-ray CT system (Heeraman et al. 1996). From the attenuation distribution in this image, total root length was estimated from root volume, assuming that the roots are cyli ndrical, and was compared with destructive root measurements. Total root volume as estimated from CT was 2.97 cm^3, whereas destructive root measurements yielded a total root volume of 2.2 cm^3 for the same depth interval. Total root length as estimated from destructive and CT measurements were 8.65 and 11.7 m, respectively for the 1.2-2.0 cm depth. The overestimation of root volume using CT can be caused by signal noise and volume averaging assumptions.
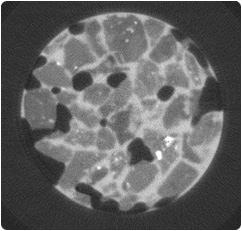
Iodide breakthrough: A 50 mm long vertical flow cell was made from a Plexiglas tube with 4.76 mm inner and 7.94 mm outer diameter, and randomly filled with precision-grade glass beads of 0.5 mm diameter.Rubber septa were placed at both ends of the tube, leaving no free space between the bead pack and the septa. Liquid inflow occurred through two needles penetrating the septum at the top of the tube. Both needle openings of 0.6 mm diameter were positioned at the horizontal center of the septum. A constant flow rate of 100 mm^3/h was maintained by a double syringe pump to "instantaneously" switch injection between water and 100 mg/mL NaI solution, with each liquid entering through one of the inflow needles.
![]()
A single needle penetrating the bottom septum was used as liquid outlet. The bead pack was initially saturated with water. A 30-min period of water injection was followed by a 90-min solution pulse of iodide and 240 min of water injection. The estimated average pore-water velocity was approximately 13.7 mm h^–1. Scans were taken continuously for the duration of the experiment and lasted approximately 20 min each, resulting in a total of 16 data sets. Each scan covered the same vertical range of 0.44 mm with its center located 20 mm below the inflow end. For practical reasons, the size of each reconstructed data set was reduced in the horizontal plane by retaining only the smallest square that completely contained the circular cross section of the bead pack, for a total of 277X277X30 voxels of 23^3 ?m3 each.
References:
Clausnitzer, C., and J.W. Hopmans. 2000. Pore-scale measurements of solute breakthrough using microfocus computed tomography. Water Resources Research 36:2067-2079. DOWNLOAD: PDF
Clausnitzer, V., and J.W. Hopmans. 1999. Estimation of phase-volume fractions from tomographic measurements in two-phase systems. Advances in Water Resources. Vol.22(6):577-584. DOWNLOAD: PDF
Wildenschild, D., J.W. Hopmans, M.L. Rivers and A.J.R. Kent 2005. Quantitative analysis of flow processes in a sand using synchrotron x-ray microtomography. Vadose Zone Journal 4:112-126. DOWNLOAD: PDF
Heeraman, D.A., J.W. Hopmans, and V. Clausnitzer. 1997. Three-dimensional
imaging of plant roots in situ with X-ray computed tomography. Plant and
Soil 183:167-179. DOWNLOAD:
PDF
Hopmans, J. W., T. Vogel, and P. D. Koblik. 1992. X-ray tomography of
soil water distribution in one-step outflow experiments. Soil Sci. Soc.
Amer. J. 56(2):355-362.
C. Recent developments at Advanced
Photon Source Measurements at Argonne National Laboratory, Chicago and
McClellan Nuclear Reactor in Sacramento.
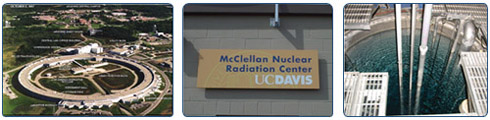
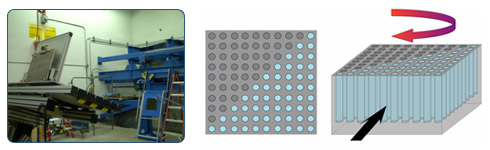
In 1999, UCD signed off on a user agreement with the University of Chicago and the Argonne National Laboratory (ANL) for UC investigators to participate in research at the Advance Photon Source of ANL. Since then, experiments were conducted at ANL to visualize soil moisture dynamics in draining soil cores, at the 10 micron scale.
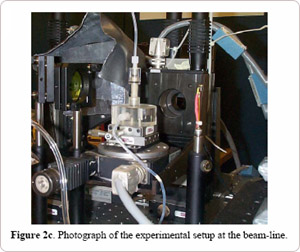
The GeoSoilEnviroCARS (GSECARS) bending magnet beamline 13-BM-D (sector 13 at the Advanced Photon Source (APS) at Argonne National Laboratory) provides a parallel beam of high-brilliance radiation with a vertical beam size of about 5 mm. Using a monochromator, the white synchrotron light is decomposed into different wavelengths, so that it is possible to customize the radiation to the desired monochromatic energy level. The scanned object can be translated and rotated automatically in the beam, however, since the detector is two-dimensional, a complete three-dimensional image is obtained in each scan/rotation. The transmitted x-rays are converted to visible light with a synthetic garnet (YAG) scintillator. The visible light from the scintillator was imaged with a 5X Mitutoyo microscope objective onto a high-speed 12-bit CCD camera (Princeton Instruments Pentamax), with 1317x1035 pixels, each 6.7x6.7 micron in size. The raw data used for tomographic reconstruction are 12-bit images and a total of 360 such images were collected as the sample was rotated twice from 0 to 180 degrees in 0.5-degree steps.
Through the Office of Research at UC Davis, we received a DOE grant, in close collaboration with Oregon State University, with the main objective to expand on research capabilities of the neutron beam at McClellen Nuclear Radiation Center (MNRC). Our part of this so-called Western Nuclear Science Alliance (WNSA) project is to explore the potential of using fast neutron beam imaging for soil studies, specifically how this technique can complement x-ray radiography and CT, e.g. using deuterium as a conservative tracer. The initial study may result in much larger grant funding, such as from federal agencies as NSF, DOE, and USDA.
The Figures below show the setup of soil samples in one of the bays, and a 2x2 cm aluminum soil sample holder that contains a sand with varying water content.
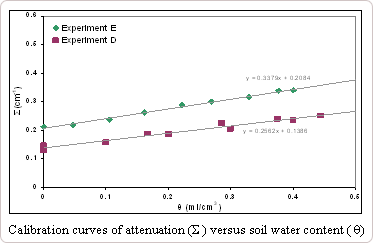
We show that linear calibration curves can be obtained:
References:
Wildenschild, D., J.W. Hopmans, C.M.P. Vaz, and M.L. Rivers. 2001. Using
x-ray beams to study flow processes in underground porous media. Advanced
Photon Source Research 4: 48-50. Link to APS_report_2001. DOWNLOAD:
PDF